UC Santa Cruz Title IX Office 15/16 Data
In 2015/16, the Title IX Office received 233 reports. 231 reports were related to gender discrimination and gender based harm. Many reports received by the Title IX Office include more than one concern or allegation of misconduct.
It is important to note that in many instances, the Title IX Office receives more than one report about the same incident or affected party from more than one responsible employee. We value these additional reports because they may help us to gather more information. Additionally, they reflect the growing awareness of the campus about reporting responsibilities and the campus commitment to preventing Sexual Violence and Sexual Harassment. For the sake of clarity, our office aggregates the various reports received about each unique incident.
Formal Investigations
During the 15/16 fiscal year, the Title IX Office launched 49 formal investigations. The average number of business days to complete formal investigations launched in 15/16 was 133. The total number of formal Investigations completed in 15/16 was 41. 15 of the 41 investigations completed in 15/16 were launched in 14/15.
Type of Incident Reported to the Title IX Office
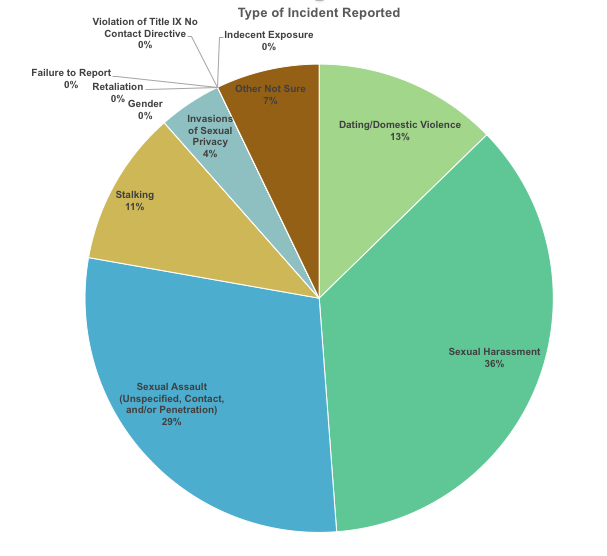
Type of Incident Reported |
# |
% |
| Sexual Harassment | 91 | 36% |
| Sexual Assault (Unspecified, Contact, and/or Penetration) | 73 | 29% |
| Dating/Domestic Violence | 32 | 13% |
| Stalking | 27 | 11% |
| Invasions of Sexual Privacy | 11 | 4% |
| Gender | 0 | 0% |
| Retaliation | 0 | 0% |
| Failure to Report | 0 | 0% |
| Violation of Title IX No Contact Directive | 0 | 0% |
| Indecent Exposure | 0 | 0% |
| Other Not Sure | 18 | 7% |
| Total | 252 | 100% |
The combined Type of Incident Reported is greater than the total number of reports received in 15/16 due to instances where more than one type of incident is reported to the Title IX Office.
Complainant Affiliation
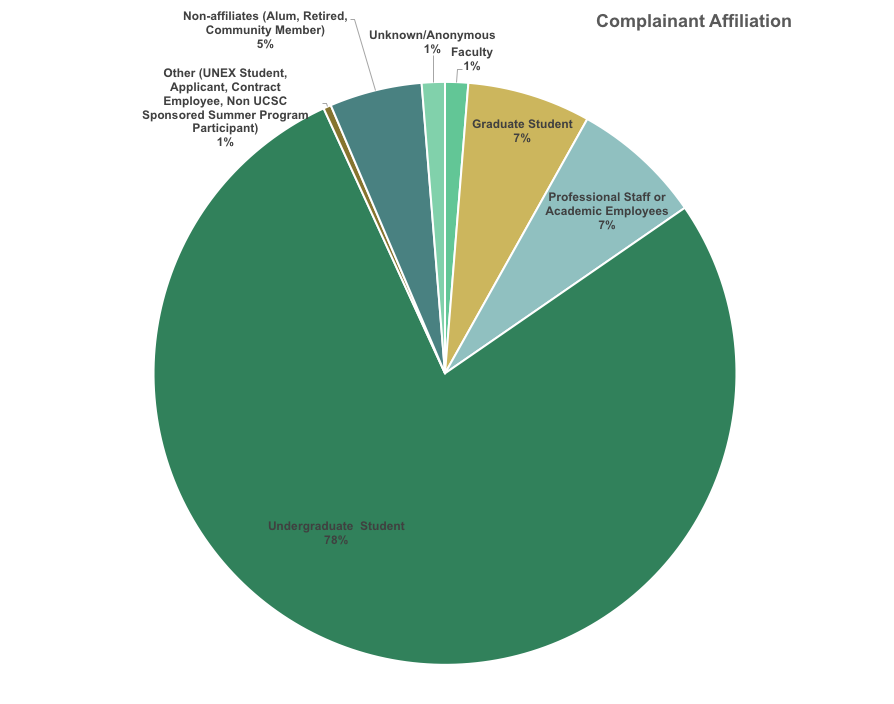
Complainant Affiliation |
# |
% |
| Undergraduate Student | 182 | 78% |
| Professional Staff or Academic Employees | 17 | 7% |
| Graduate Student | 16 | 7% |
| Non-affiliates (Alum, Retired, Community Member) | 12 | 5% |
| Faculty | 3 | 1% |
| Other (UNEX Student, Applicant, Contract Employee, Non UCSC Sponsored Summer Program Participant) | 1 | 1% |
| Unknown/Anonymous | 3 | 1% |
| Total | 234 | 100% |
The total number of complainants is not equal to the number of reports due to reports which involve more than one complainant with unique affiliations.
Respondent Affiliation
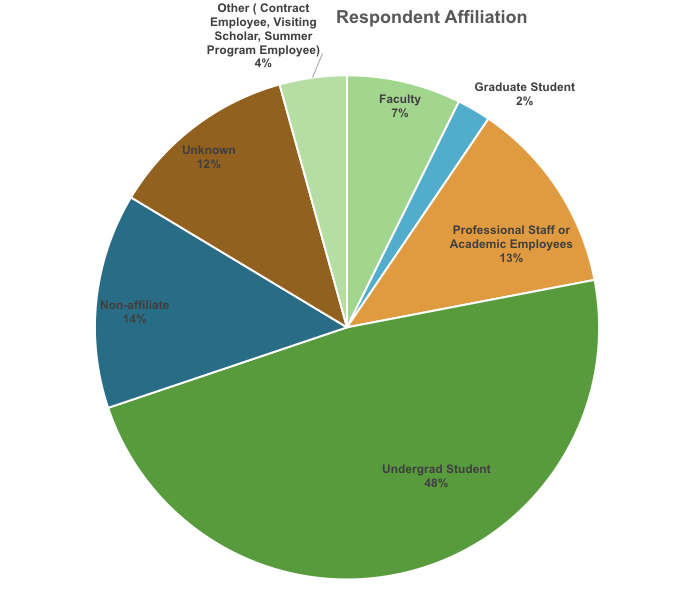
Respondent Affiliation |
# |
% |
| Undergraduate Student | 111 | 48% |
| Non-affiliate | 32 | 14% |
| Professional Staff and Academic Employees | 29 | 13% |
| Faculty | 17 | 7% |
| Other (Contract Employee, Visiting Scholar, or Summer Program Employee) | 10 | 4% |
| Graduate Student | 5 | 2% |
| Unknown | 28 | 12% |
| Total | 232 | 100% |
The total number of respondents is not equal to the number of reports due to reports involving more than one respondent.
