UC Santa Cruz Title IX Office 16/17 Data
In 2016/17 the Title IX Office received 360 reports related to gender discrimination and gender based harm. While the office received 389 reports, 29 of these reports were not related to gender discrimination or gender-based harm and were referred to the appropriate campus resource. Many reports received by the Title IX Office include more than one concern or allegation of misconduct. In 8% of the initial reports received, while Title IX did outreach whenever possible, the allegation did not appear to be Title IX related.
It is important to note that in many instances, the Title IX Office receives more than one report about the same incident or affected party from more than one responsible employee. We value these additional reports because they may help us to gather more information. Additionally, they reflect the growing awareness of the campus about reporting responsibilities and the campus commitment to preventing Sexual Violence and Sexual Harassment. For the sake of clarity, our office aggregates the various reports received about each unique incident.
Formal Investigations
During the 16/17 academic year, the Title IX Office launched 40 formal investigations. The average business days to complete investigations launched in 16/17 was 154. The total number of formal investigations completed during the 16/17 academic Year 16/17 was 31.
Type of Incident Reported
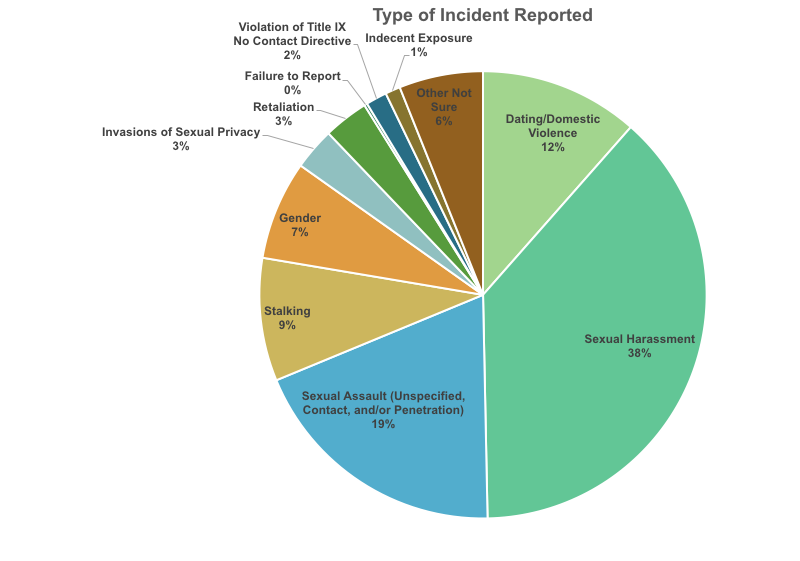
| Type of Incident Reported | # | % |
| Sexual Harassment | 176 | 38% |
| Sexual Assault (Unspecified, Contact, and/or Penetration) | 88 | 19% |
| Dating/Domestic Violence | 53 | 12% |
| Stalking | 41 | 9% |
| Gender | 33 | 7% |
| Invasions of Sexual Privacy | 14 | 3% |
| Retaliation | 15 | 3% |
| Violation of Title IX No Contact Directive | 7 | 2% |
| Indecent Exposure | 5 | 1% |
| Failure to Report | 1 | 0% |
| Other Not Sure | 28 | 6% |
| Total | 461 | 100% |
The total number Type of Incident Reported does not equal the total number of reports received in 16/17 due to many reports involving more than one type of incident.
Complainant Affiliation
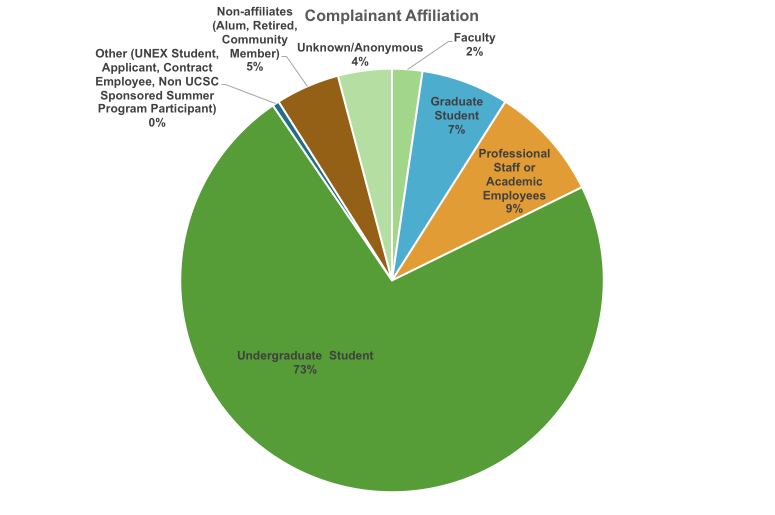
Complainant Affiliation |
# |
% |
| Undergraduate Student | 283 | 73% |
| Professional Staff and Academic Employees | 34 | 9% |
| Graduate Student | 26 | 7% |
| Non-affiliates (Alum, Retired, Community Members) | 19 | 5% |
| Faculty | 9 | 2% |
| Other (UNEX Student, Applicant, Contract Employee, Non UCSC Sponsored Summer Program Participant | 2 | 0% |
| Unknown/Anonymous | 16 | 4% |
| Total | 389 | 100% |
Respondent Affiliation
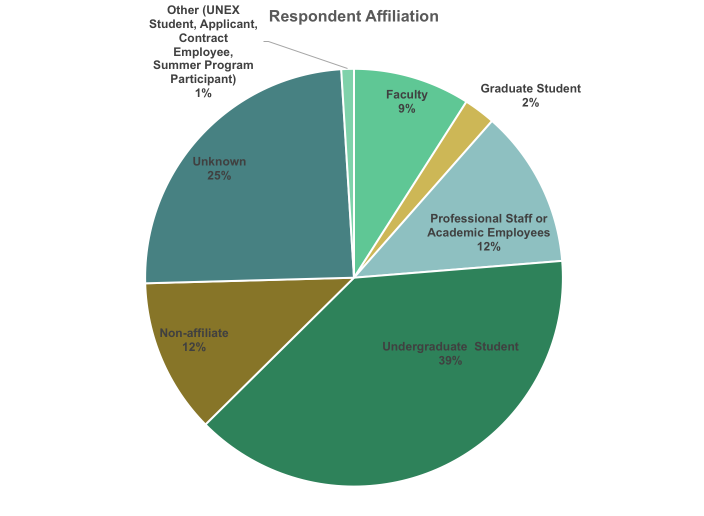
Respondent Affiliation |
# |
% |
| Undergraduate Student | 159 | 39% |
| Professional Staff including Academic Employees | 50 | 12% |
| Non-affiliate (Alum, Retired, Community Members) | 49 | 12% |
| Faculty | 37 | 9% |
| Graduate Student | 10 | 2% |
| Other (UNEX Student, Applicant, Contract Employee, Summer Program Participant) | 4 | 1% |
| Unknown | 100 | 25% |
| Total | 409 | 100% |
The total number Respondent Affiliation does not equal the number of incidents reported in 16/17 due to reports involving more than one type of incident.
