UC Santa Cruz Title IX Office 17/18 Data Report
This report is based on data collected by the Title IX Office in the 2017/18 academic year. The Title IX Office reports numbers based on a fiscal year beginning July 1 and ending June 30.
It is important to note that data from the Title IX Office varies significantly from the Annual Security Review and Fire Safety Report required by Clery and reported out of the UC Santa Cruz Police Department. The Annual Security Review and Fire Safety Report aggregates annual crime statistics in compliance with the Clery Act, including only crimes that take place on campus, on public property adjacent to and accessible from the campus, and/or on property controlled by the university. The Title IX Office utilizes different standards and definitions based upon the UC Policy on Sexual Violence and Sexual Harassment, Title IX of the Education Amendments Act of 1972, the Violence Against Women Act, federal guidance provided by the Office for Civil Rights, and California state law and includes reports and complaints involving UCSC affiliates regardless of the location of the incident.
Education and Training
The Title IX Office provides tailored in person and online trainings to the UC Santa Cruz campus community. All students, staff, and faculty must complete ongoing training aimed at preventing and improving our response to sexual violence and sexual harassment. During the 17/18 fiscal year, the Title IX Office provided more than 75 in person training to over 8,400 campus affiliates. We also helped to provide ongoing online training to students, staff, and faculty.
Reports to the Title IX Office
In 2017/18, the Title IX Office received 352 reports regarding gender discrimination and gender-based harm. While the office received 400 unique incident reports, after initial review, the office determined that 48 of these reports were not related to gender discrimination or gender-based harm and the parties were referred to the appropriate campus resource. We do include these reports for the data on respondent and complainant type.
It is important to note that in many instances, the Title IX Office receives more than one report about the same incident or affected party from more than one responsible employee. While we combine multiple reports for clarity in data, these additional reports may help us to gather more information and to better assist and/or prevent future harm. Additionally, they reflect the growing awareness of the campus about reporting responsibilities and the campus commitment to preventing gender discrimination and gender based harm.
Alternative Resolution
The Title IX Office used an alternative resolution to address 20% of the reports we received in 2017/18. These actions include but are not limited to: educating parties to prevent future incidents, ensuring access to any university related event, program or class, providing mediation and conducting targeted trainings. Alternative Resolutions do not include a formal investigation.
There is not a 1:1 correspondence between incidents and investigations. One report made to the Title IX Office may involve more than one respondent and/or more than one incident. We may also receive singular reports of multiple incidents.
Formal Investigation
The Title IX Office initiated investigations into 9% of the reports received in 2017/18. Some of these investigations involve multiple complainants and/or reports.
During the Academic Year 17/18, the Title IX Office completed 41 formal investigations. Of the 41 investigations initiated in 17/18, the Title IX Office substantiated allegations of one or more policy violations related to gender based harm in 66% of the investigations. The Title IX Office referred each of these cases to the appropriate adjudicating body as required by policy, depending on the status of the respondent.
Link to UC Student Adjudication Model January 2016.
Link to UC Investigation and Adjudication Framework for Staff and Non-Faculty Academic Personnel
Link to UC Investigation and Adjudication Framework for Senate and Non-Senate Faculty
The average business days for completing investigations launched in 17/18 was 108 days. We strive to complete the investigations within 60 business days and have taken significant steps to reduce the length of time to complete formal investigations. This past year, we reduced the average length of time from 164 days in 2016/17 to 108 in 2017/18. The office focused on streamlining its work to more expediently respond to allegations and improve administrative processes to make significant gains in improving the timeliness of investigations. This led to a 34% improvement in the average investigation timeline overall.
Factors that impact the timeliness of an investigation include: volume and availability of evidence, complexity of the case, availability of; witnesses, complainant, respondents and or their advisors and support people, health of the parties, need to coordinate with criminal investigations, etc.
You can access more information about the formal investigation process here.
Limitations
In 71% of the reports we received the Title IX Office's actions and ability to respond were limited due to insufficient information, the complainant's choice, and/or no response to outreach from the complainant. In 28% of these cases, the respondent was not affiliated with the university and thus not subject to university policy. However, in all of these cases, the Title IX Office provided resources, referrals, and support options to the complainant and maintains a private record of the report in case of additional information or future reports.
Reporting Party
24% of the reports made to the Title IX Office in 2017/18 were made directly by the complainant. 67% of the reports were made by responsible employees. Under the UC Policy on Sexual Violence and Sexual Harassment, all university employees who are not designated confidential have requirements to report sexual violence and sexual harassment to the Title IX Office. The remaining reports were made by optional reporters such as students who were not employees and the confidential CARE Office upon the request of the complainant.
Type of Incident Reported to Title IX Office
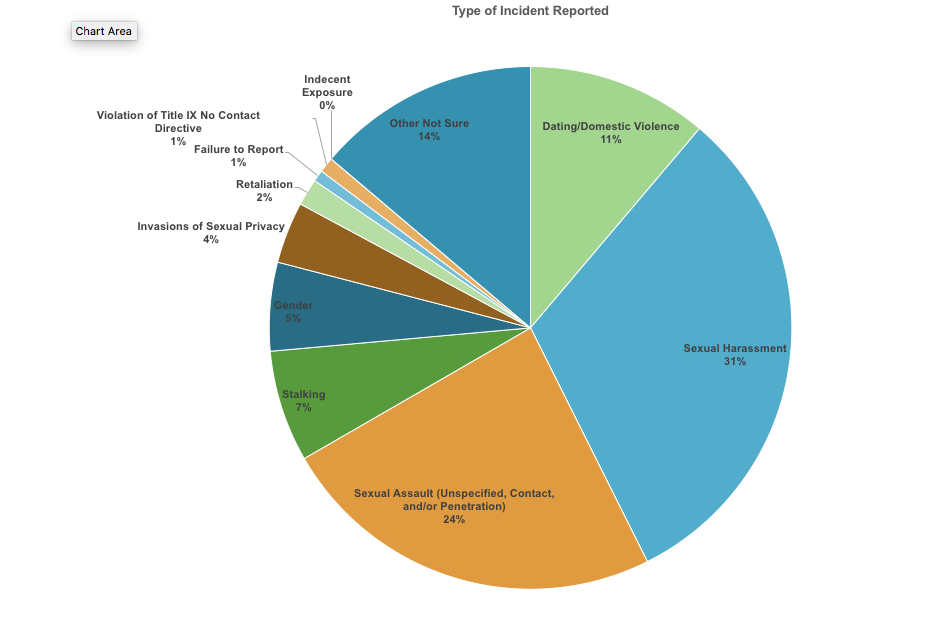
Type of Incident Reported |
# |
% |
|
Sexual Harassment |
132 |
31% |
|
Sexual Assault (Unspecified, Contact, and/or Penetration) |
101 |
24% |
|
Dating/Domestic Violence |
47 |
11% |
|
Stalking |
29 |
7% |
|
Gender |
23 |
5% |
|
Invasions of Sexual Privacy |
16 |
4% |
|
Retaliation |
7 |
2% |
|
Violation of Title IX No Contact Directive |
4 |
1% |
|
Failure to Report |
3 |
1% |
|
Indecent Exposure |
0 |
0% |
|
Other/Not Sure |
58 |
14% |
|
Total |
420 |
100% |
The total Type of Incident Reported does not equal the total number of reports received in 17/18 due to reports involving more than one type of incident.
Summary For Close Reason
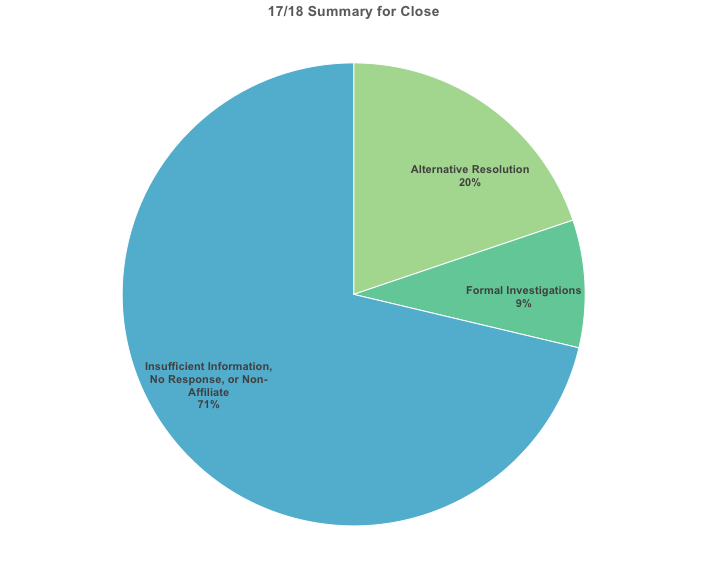
Summary for Close Reason |
# |
% |
|
Alternative Resolution |
68 |
20% |
|
Formal Investigations |
30 |
9% |
|
Insufficient Information, No Response, Non-Affiliate, and/or Complainant Declines Further Action |
254 |
71% |
Complainant Affiliation
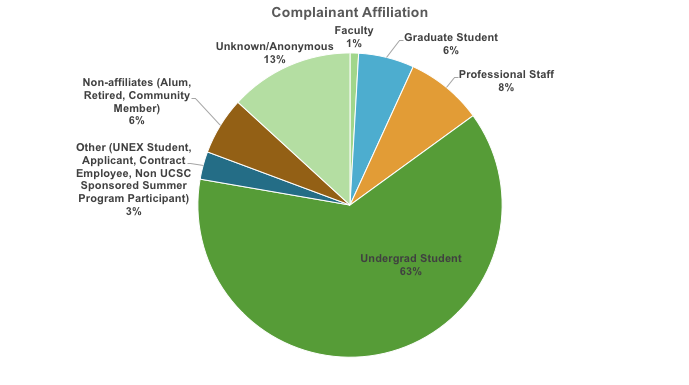
Complainant Affiliation |
# |
% |
|
Undergrad Student |
276 |
63% |
|
Professional Staff or Academic Employee |
36 |
8% |
|
Graduate Student |
26 |
6% |
|
Non-affiliates (Alum, Retired, Community Member) |
27 |
6% |
|
Other (UNEX, Applicant Contract Employee, Summer Program Particpant) |
13 |
3% |
|
Faculty |
4 |
1% |
|
Unknown |
58 |
13% |
|
Total |
440 |
100% |
The total number Complainant Affiliation does not equal the number of reports received in 17/18 due to instances where the complainant affiliation is known but their identity is unknown. Additionally, a report may involve be more than one complainant affiliation when there is more than one complainant with unique affiliations.
Respondent Affiliation
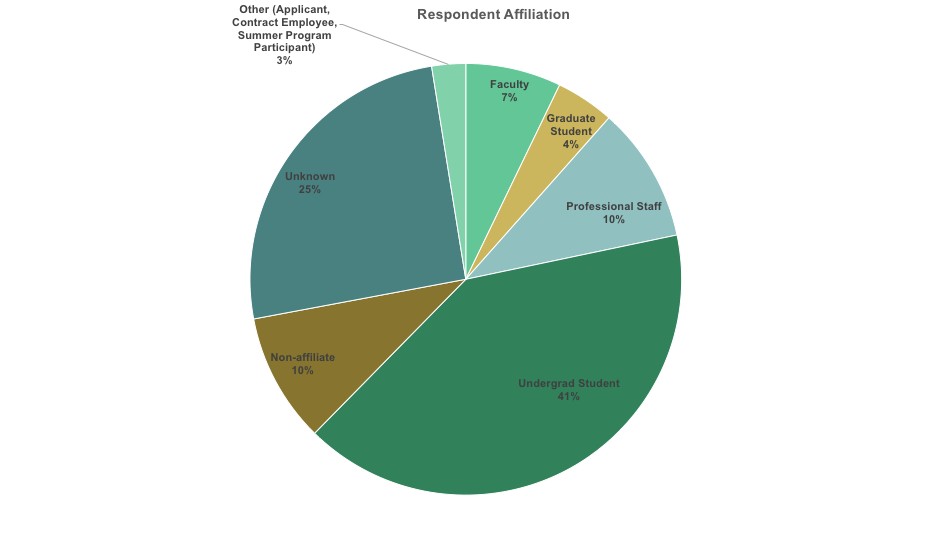
Respondent Affiliation |
# |
% |
|
Undergraduate Student |
176 |
41% |
|
Professional Staff and Academic Employees |
44 |
10% |
|
Non-affiliate (Alum, Retired, Community Member) |
42 |
10% |
|
Faculty |
31 |
7% |
|
Graduate Student |
19 |
4% |
|
(Other (Applicant, Contract Employee, Summer Program Participant) |
11 |
3% |
|
Unknown |
110 |
25% |
|
Total |
433 |
100% |
The total Respondent Affiliation does not equal the total number of reports received due to incidents where the respondent affiliation is known but their identity is not. In these instances a respondent will be counted in more than one way.
Limited Data is available for:
Title IX Office 2015/16 Data
Title IX Office 2016/17 Data
